As teachers, we may never know the impact we have on our students. I still remember quite a few of my elementary and high school teachers, especially my math teachers (since I, myself, became a math teacher). We may never know if the time, effort, compassion, and love we spend on our students actually makes a difference or not. As a teacher, though, I was comfortable with those thoughts.
The vision for my students was to make them better math learners. I believed that teaching only to have them pass the class or a standardized end-of-year test was short-sighted and did not serve the best interest of my students.
Teaching students to understand math and learn on their own, helps them more in their future math classes. I may never see them become better math students in future classes, but, I believed what I did had a lasting effect.
A common definition of (biblical) faith is: “Now faith is being sure of what we hope for and certain of what we do not see.” Does not this describe what I wrote at the beginning of this blog? Interestingly, doesn’t math fluency have a direct correlation with this idea?
Read the excerpts below from research studies on math fluency:
“Educators and cognitive scientists agree that the ability to recall basic math facts fluently is necessary for students to attain higher-order math skills… If a student constantly has to compute the answers to basic facts, less of that student’s thinking capacity can be devoted to higher level concepts than a student who can effortlessly recall the answers to basic facts.”1 Computational Fluency is part of an essential foundation for more advanced performance.2
Isn’t this “being certain of what we do not see..”? For most of us, we will never know the impact of our students becoming fact fluent. Additionally, fact fluency also leads to more confidence and quicker work, which also can affect their “bottom line”– better grades and higher test scores.
Fact Fluency is not built in a day. Fluency is a process on-going throughout the year. Don’t stop working on fact fluency as you move toward the end of the year! I know the pressure of having to get all your material finished, with spring break approaching, and end of year testing looming.
We at Fluency Games want to help! Our game site continues to be free to use.
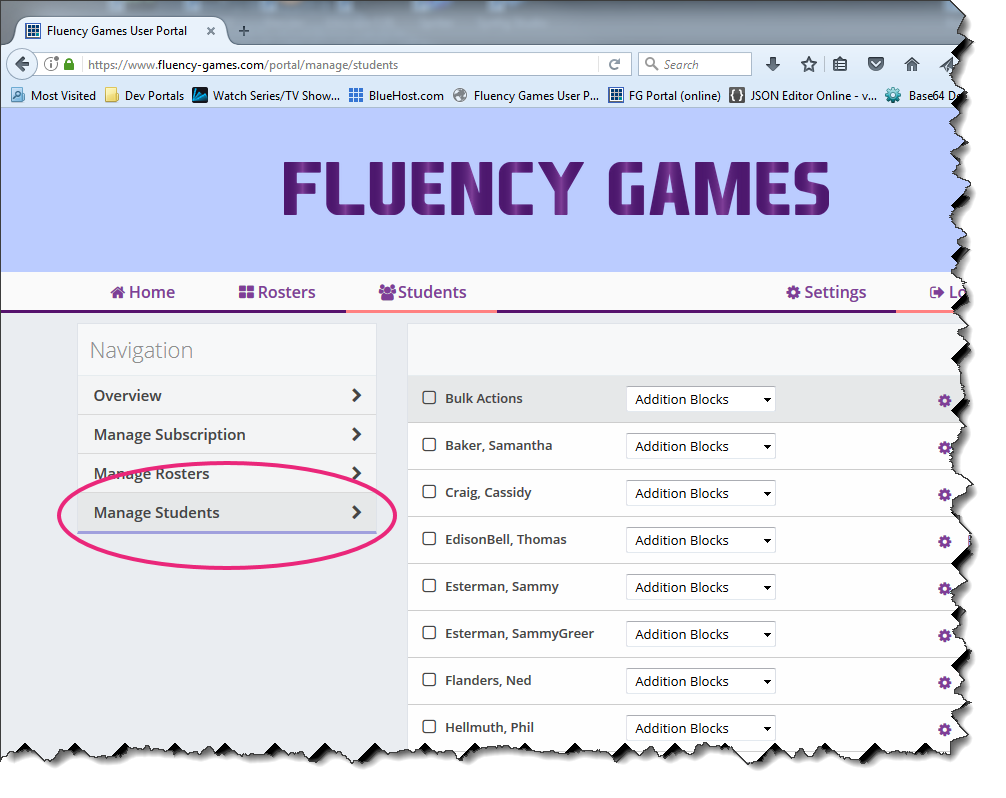
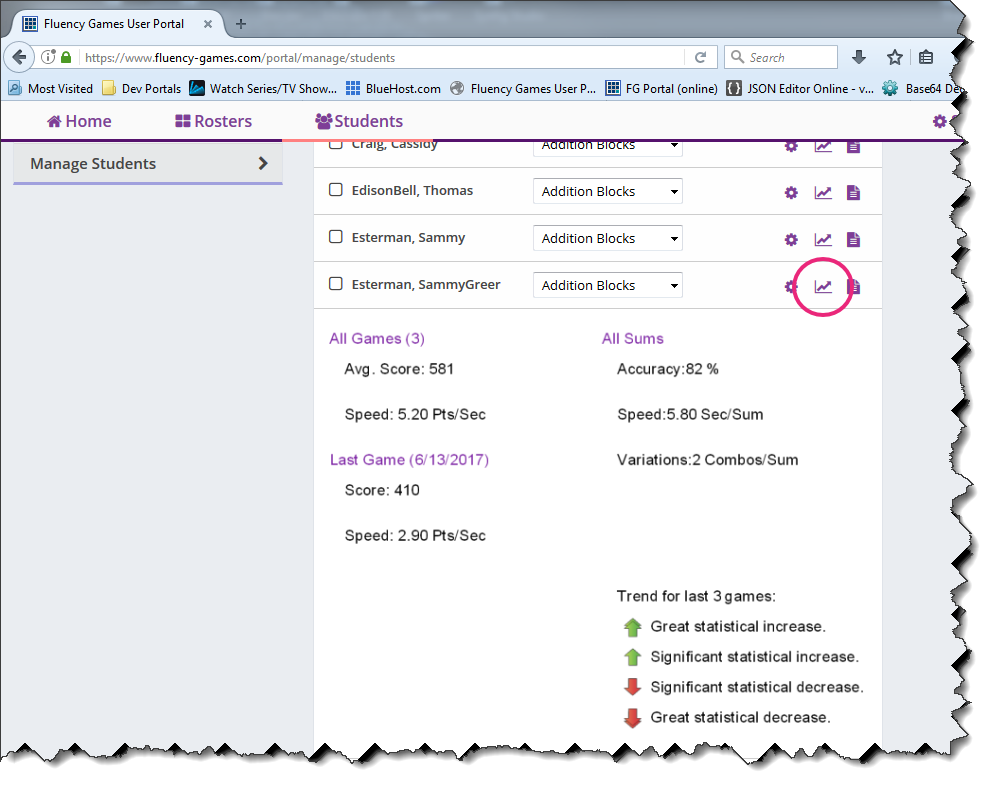
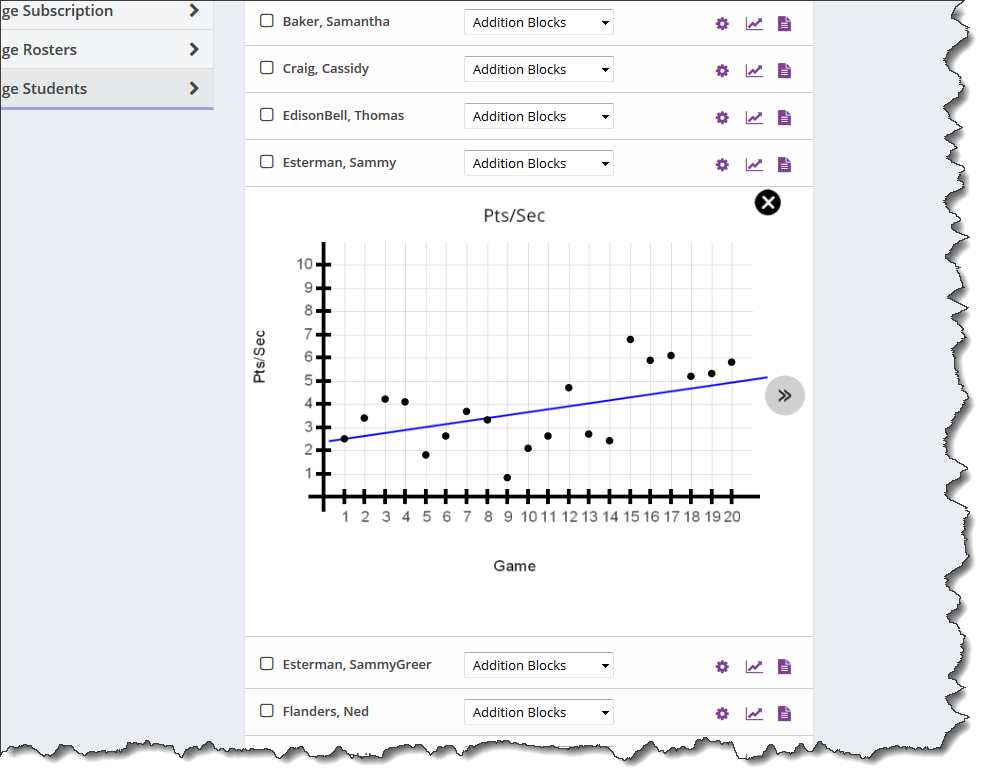
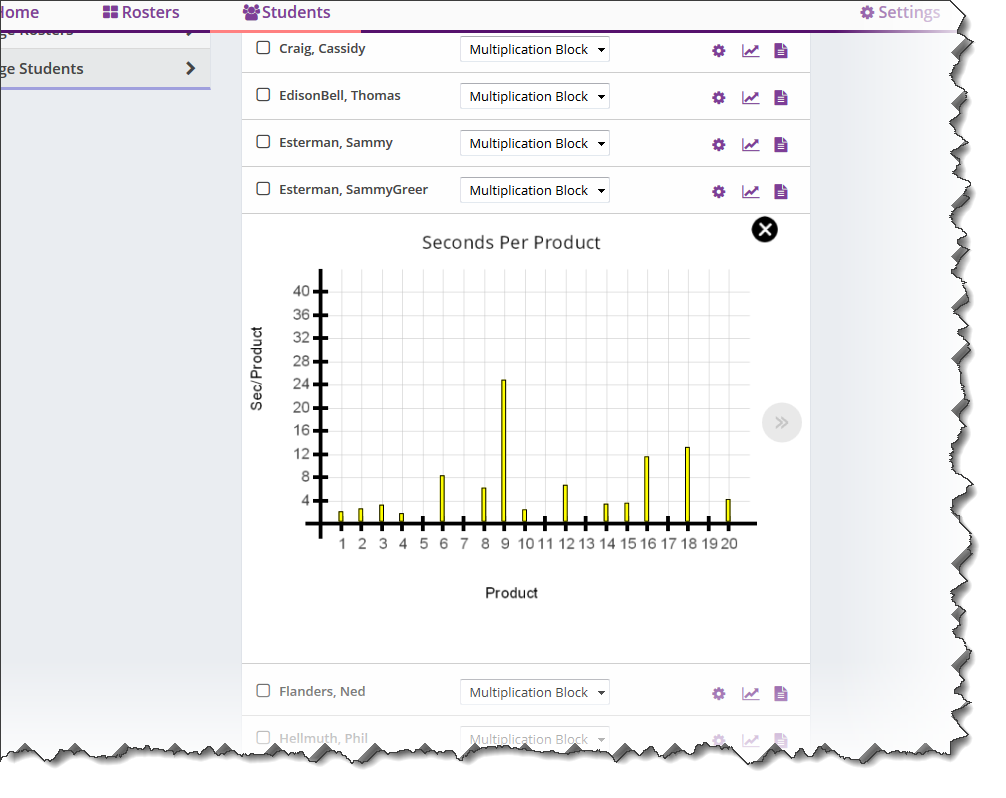
However, we are also offering a 3-month trial classroom licenses to our Teacher Portal for you to use for the rest of the year. Click here to sign up today to get the full three months of use!
1 http://www.scholastic.com/administrator/math/pdf/FM_White_Paper.pdf
2 http://eps.schoolspecialty.com/downloads/other/acad-math/research_math_fluency.pdf

