The new teacher portal by Fluency Games allows teachers to monitor progress and performance as students use our apps. Teachers will need to create their class roster first, then set up the game options before students can log in. Students must be logged into the game to have the progress information saved to our databases.
To view progress and game data:
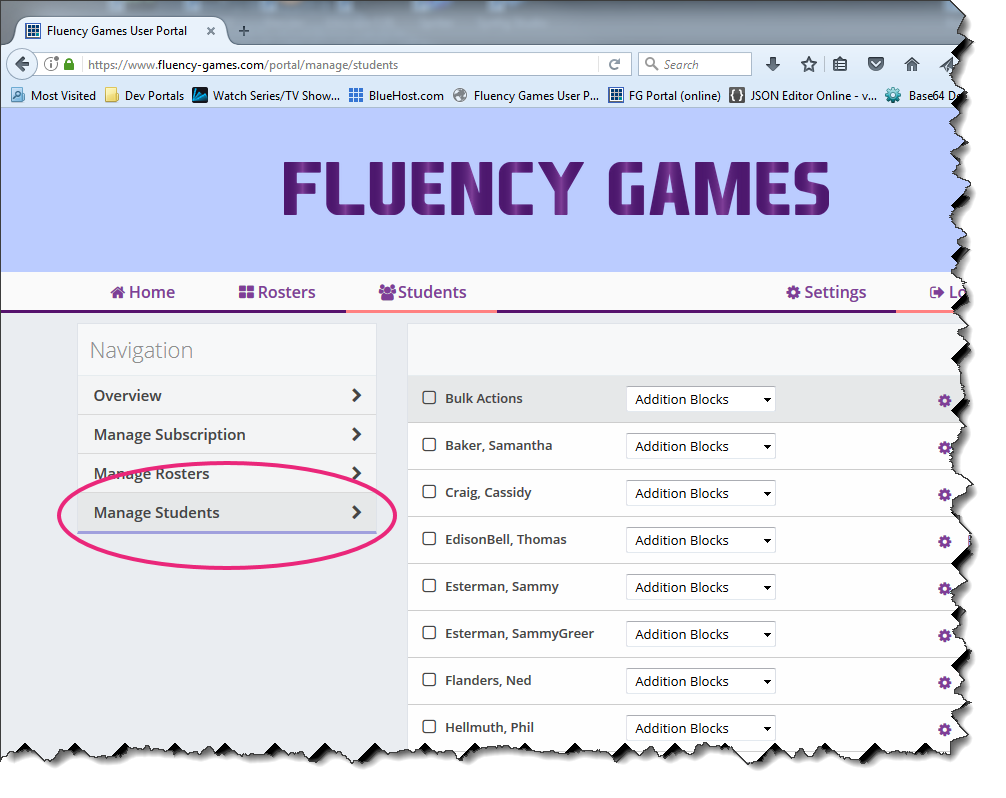
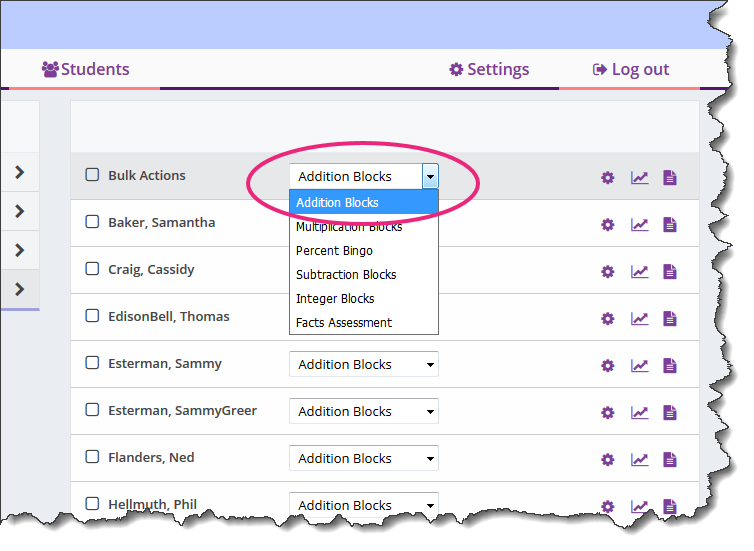
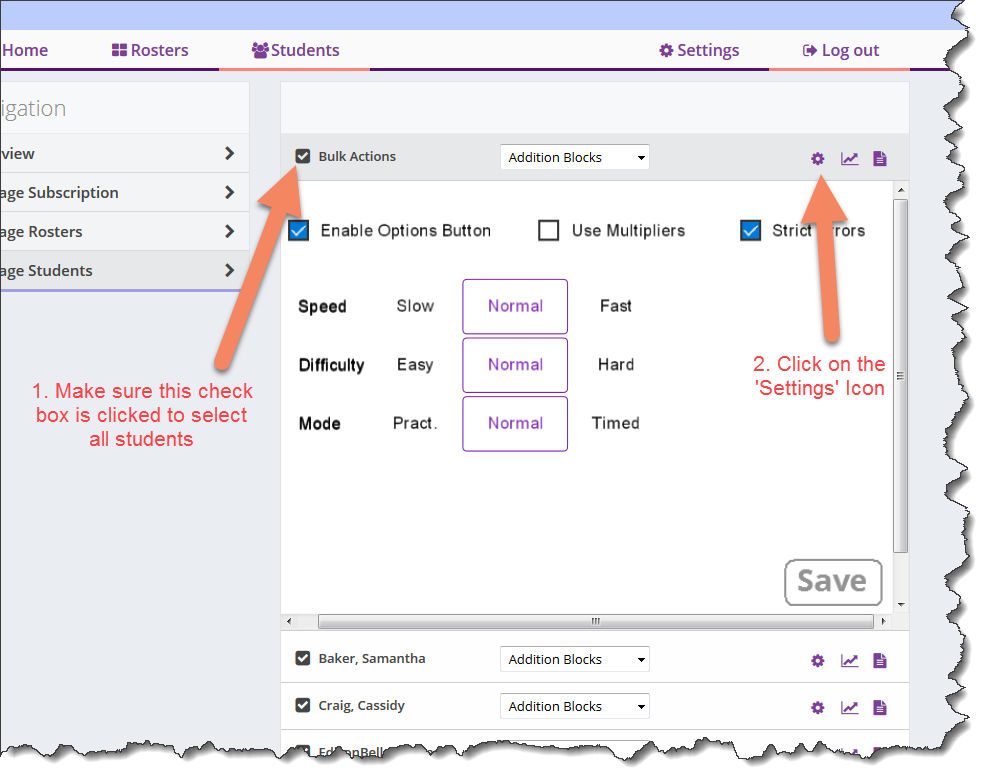
Click ‘Manage Students‘ on the left hand menu if you are currently not on that page.
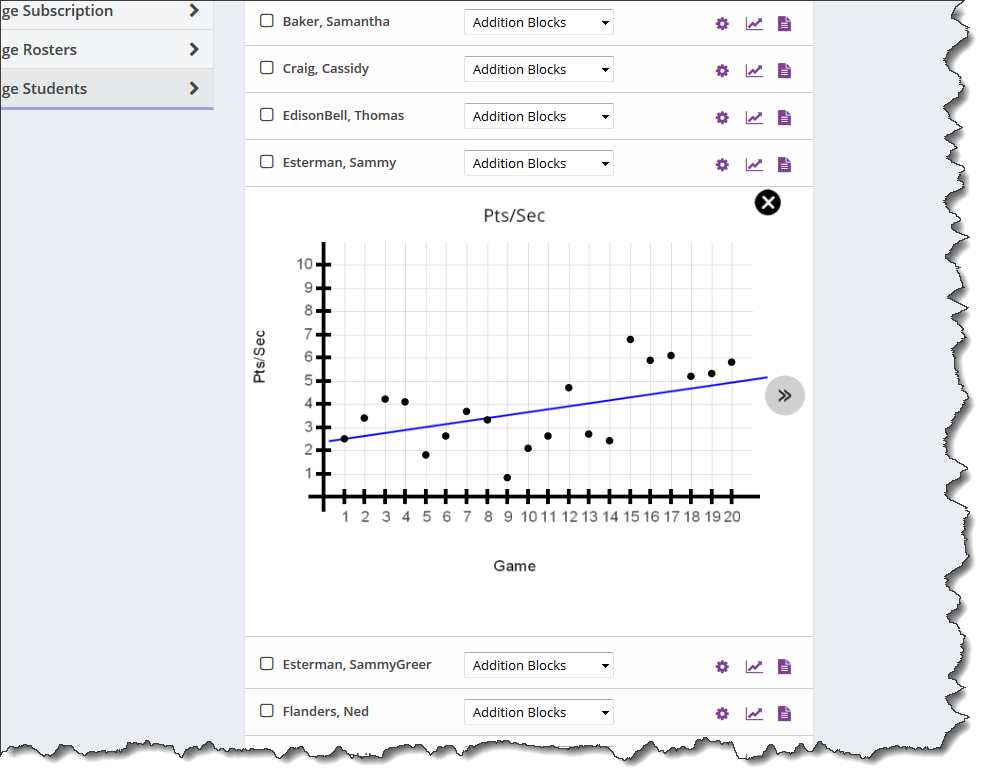
Click the Reports Icon on the right side of the student. The summary report will be displayed for the currently selected product.
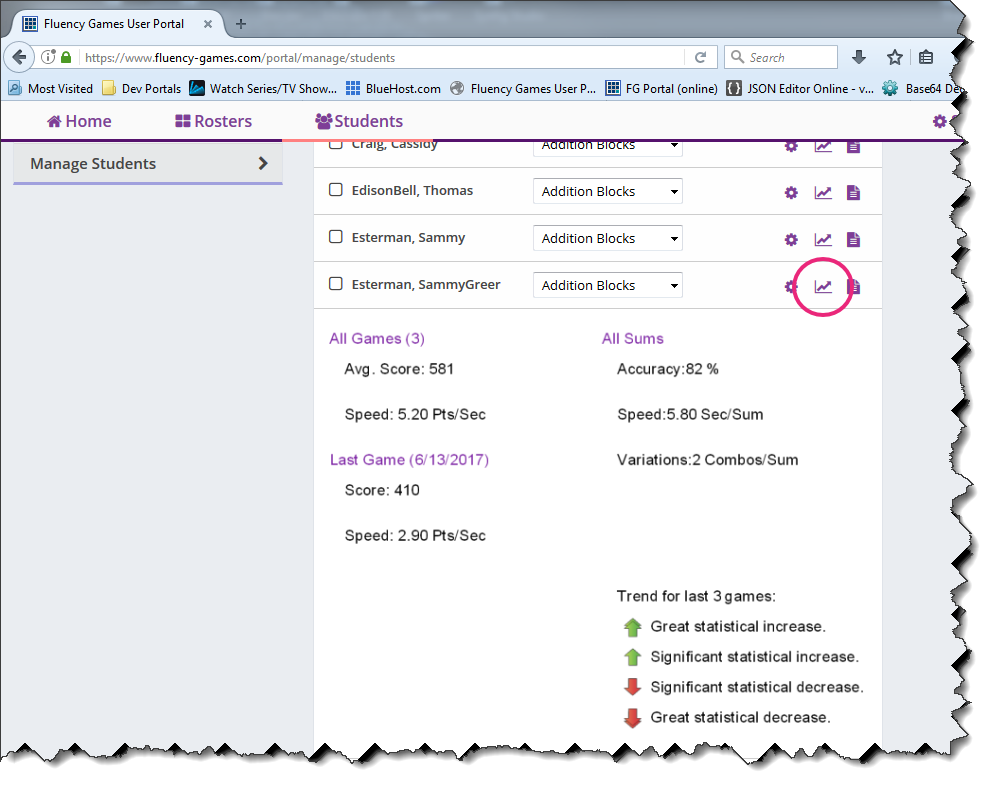
Each metric is hyperlinked to a graphical report that will display more individual data. The graph in the example below shows the Pts/Sec for each individual game (in sequence played). Here we can see the student increase, then falls off, then increases, then falls off again, then increases consistently.
This is a typical graph of student using our apps. The teacher changes the settings (increases speed or difficulty) after 4-5 games as the student shows progress and fluency.
The next graph shows the Speed (in seconds) for each individual product from Multiplication Blocks. As the graph shows below, the student, for some reason, had trouble with his ‘9’ and ’16’, and ’18’ products.
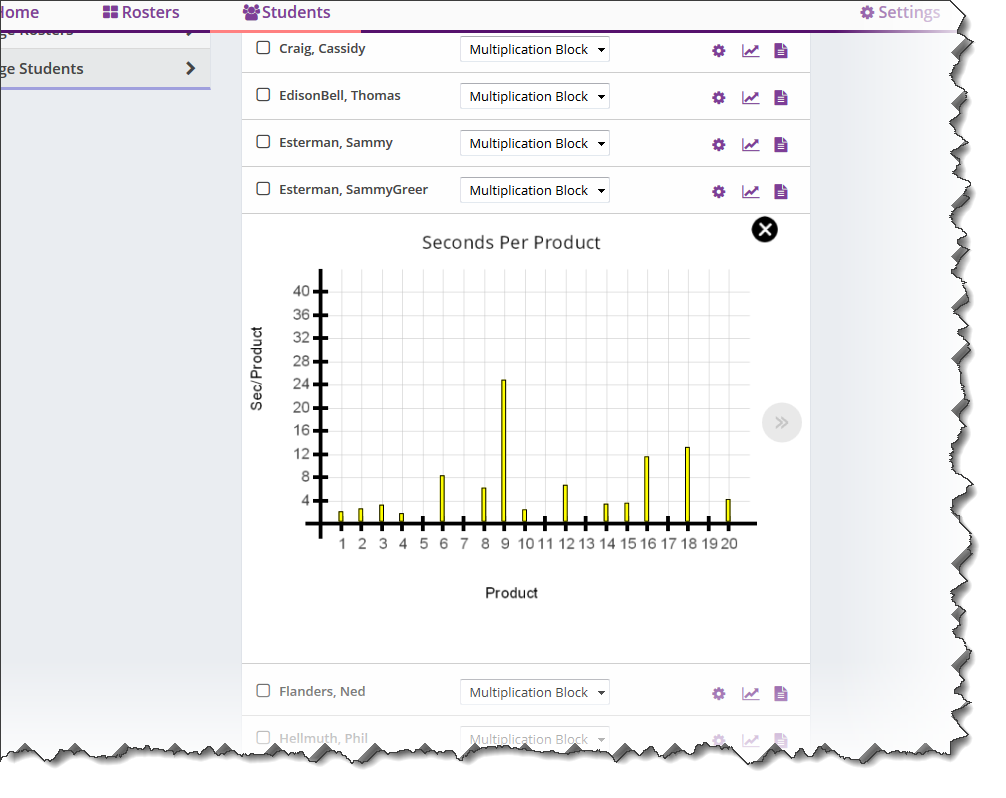
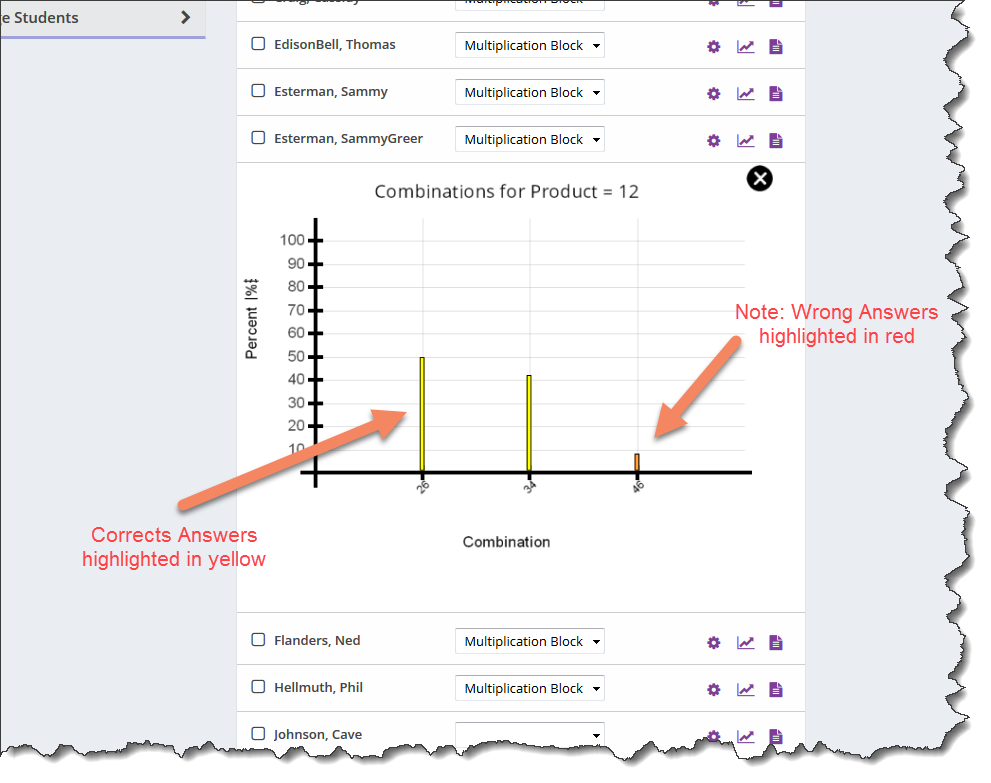
For the sums and products graphs, clicking on a specific bar will display the various combinations used by the student to get their answer. The Combinations Graph will also show wrong combinations the students attempted to use.
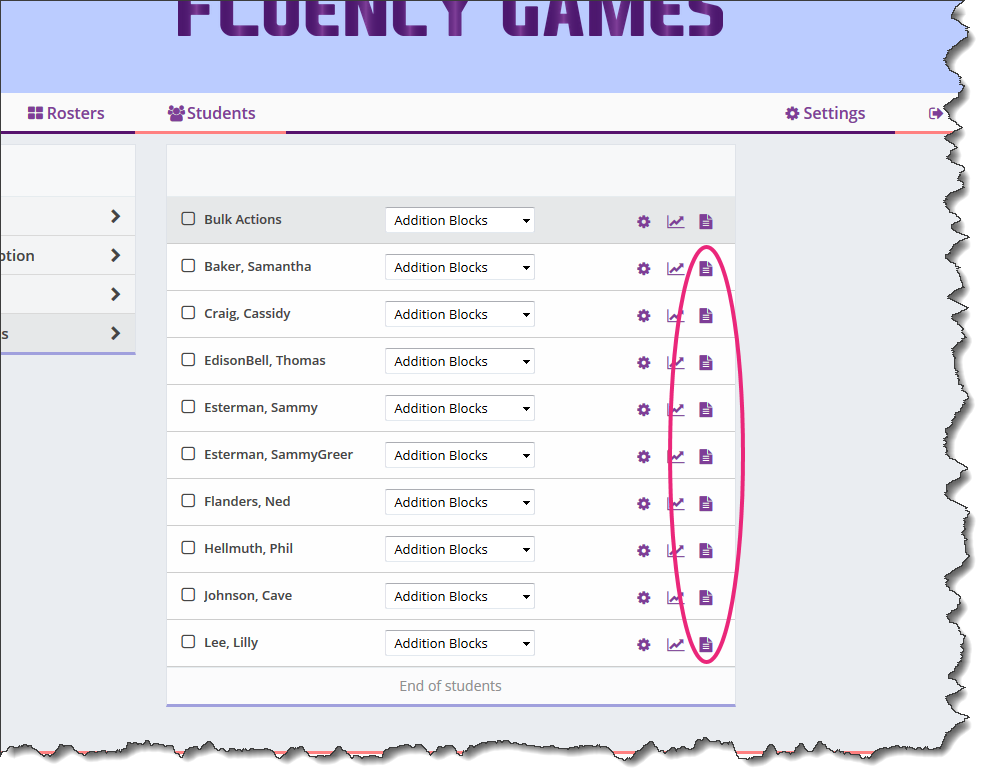
The Document Icon on the far right of the individual student will create a printer-friendly report that can be shared with the students and parents.
Note: The Bulk Actions icons for Reports and and printable Documents will create reports for all students selected.

